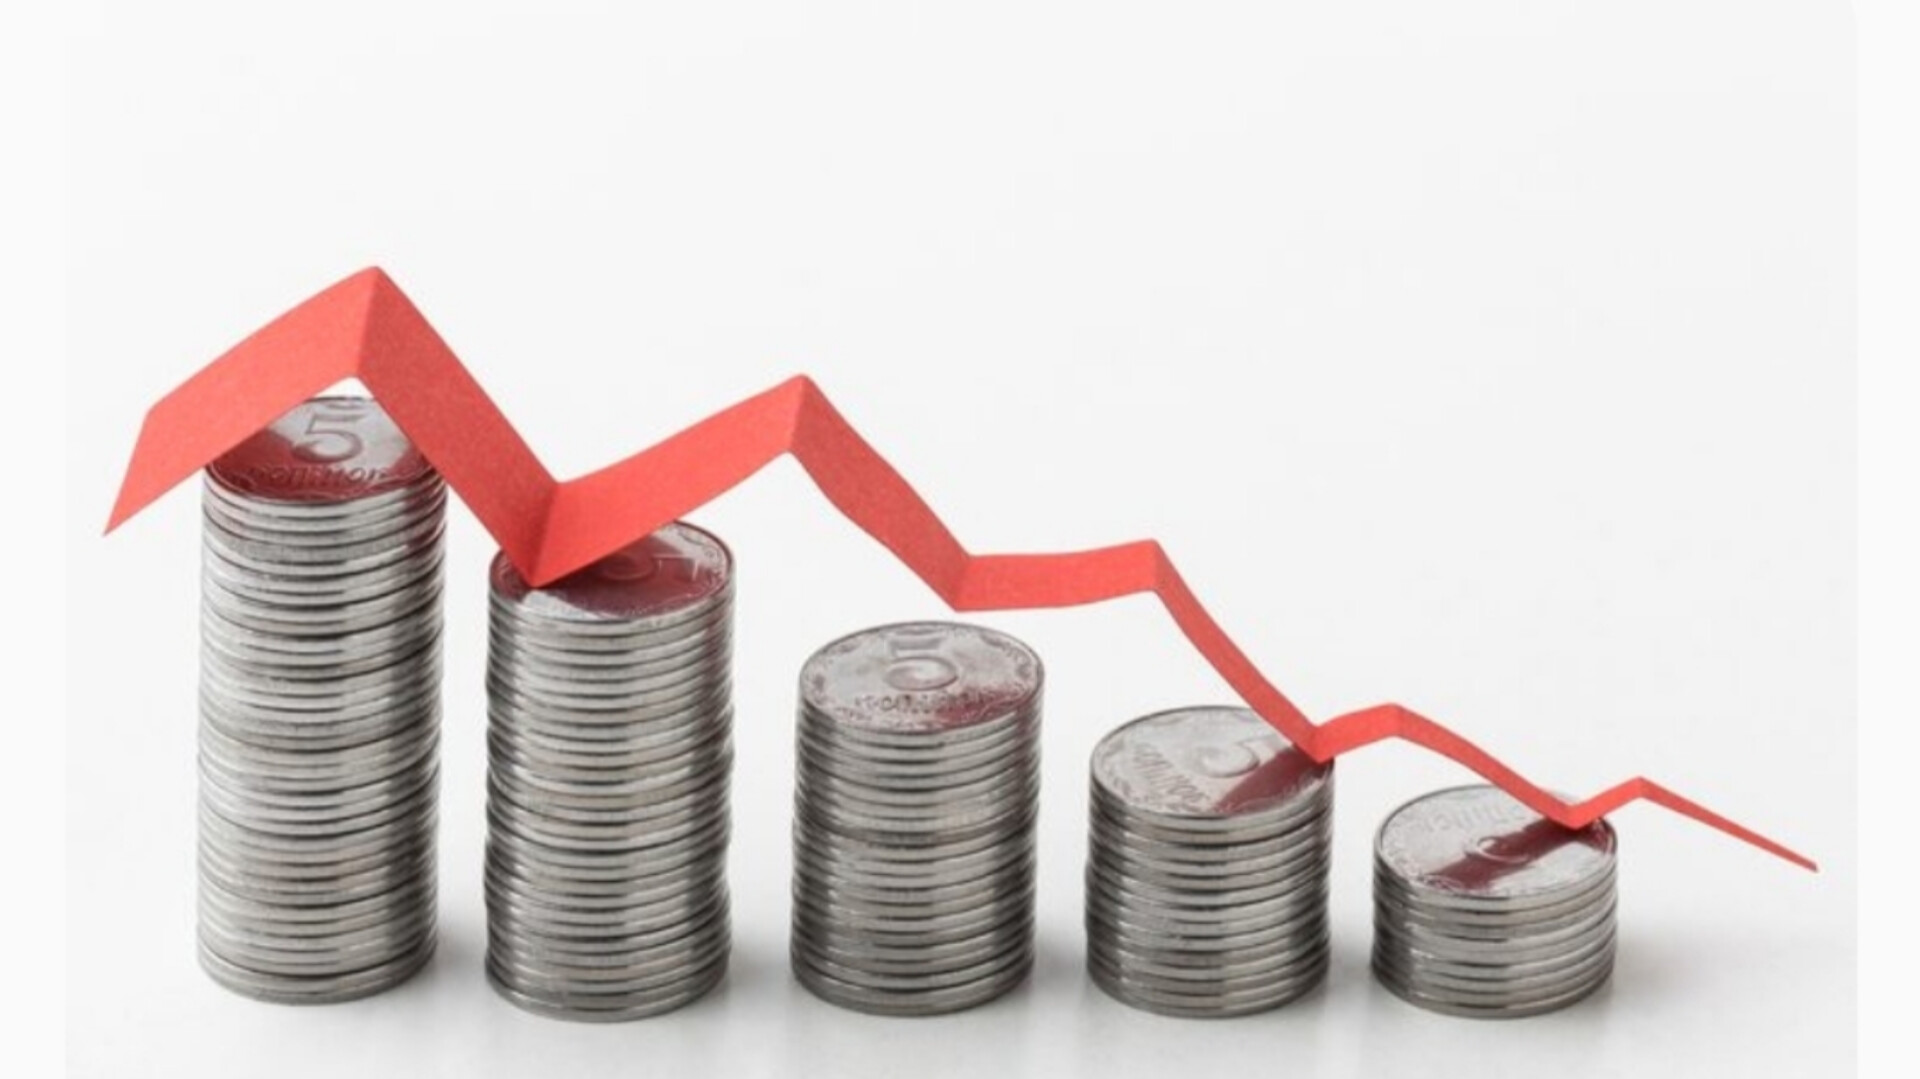
Prices consumers paid rose 3.4% in August from a year earlier, down from expectations of 3.7%, and the core measure the Federal Reserve watches closely slowed to 3.0%, according to the Bureau of Economic Analysis. The cooler reading arrived in the same report that rewrote how the government measures some prices.
What the August PCE inflation report shows
The Personal Consumption Expenditures price index rose 0.3% in August from July, the BEA said in its Sept. 30 release. Core PCE, which leaves out food and energy, rose 0.2% on the month. Over 12 months, the headline index is up 3.4% and the core index is up 3.0%.
Core inflation stood at 3.3% in July, which also reported that economists had forecast 3.7% for the headline figure and 3.3% for core. The headline figure came in 0.3 percentage points below the forecast, and core inflation fell 0.3 points from July.
Bill Adams, chief U.S. economist at Fifth Third Commercial Bank, told Deseret News that inflation’s trend is “lower but still not close” to the Fed’s target. The central bank aims for 2%. Core inflation at 3.0% sits one full percentage point above that goal, and the headline rate sits 1.4 points above it.
Energy costs remain a large part of the headline figure. The U.S. average price for regular gasoline was $4.43 a gallon on Sept. 29 and diesel was $6.41, according to figures on the Energy Information Administration daily prices page, which draws on AAA data. Both prices were down about half a percent from a week earlier.
The EIA’s weekly survey, which covers prices through Sept. 28, puts gasoline at $4.465 a gallon, $1.347 higher than a year earlier, and diesel at $6.382, up $2.628 from a year ago. The gap between regions is wide. California drivers paid $6.189 a gallon for regular and the Gulf Coast paid $3.924, a difference of $2.265, according to the EIA weekly update. The agency publishes its next weekly figures Oct. 6.
How the BEA annual update changed the measurement
The Sept. 30 release was the first to include the BEA’s annual update, which revised the data back to January 2021 using new wage figures from the Bureau of Labor Statistics and updated Medicare and Medicaid information, the agency said.
Separately, the BEA changed how it prices three service categories. Tech Times reported the categories are portfolio management and investment advice, legal services, and computer software. According to that report, portfolio management prices had been estimated partly from employment counts rather than fee data, and legal services readings had been erratic.
Analysts had flagged the change ahead of time. Confluence Investment Management wrote in an Aug. 3 note that the portfolio management change alone could lower core PCE by about 0.2 percentage points and the software change by about 0.1 point, with a smaller effect from legal services.
The note also explains why a small group of prices matters this much. Those three categories make up just over 1% of core consumer price index spending but about 4% of core PCE, because the PCE uses weights that shift with what households buy while the CPI uses fixed weights. Confluence tied part of recent PCE inflation to strong stock market performance.
Tech Times said economists had projected the revisions would trim core PCE by 0.1 to 0.2 percentage points and that the actual effect appeared larger. The BEA’s release did not break out the size of the effect on August, so the share of the drop from 3.3% to 3.0% that comes from the new method has not been published.
Consumer spending outpaces income in August
Households spent faster than they earned. Personal income rose $66.6 billion, or 0.2%, and disposable personal income, which is income after taxes, rose $68.6 billion, or 0.3%, according to the BEA. Consumer spending rose $190.8 billion, or 0.9%.
That means spending grew by almost 2.8 times as much in dollars as after-tax income did. Of the spending increase, $114.1 billion went to goods and $76.7 billion to services.
Adjusted for inflation, disposable income was unchanged for the month, while real spending rose $92.8 billion, or 0.6%. The BEA said the income gain came mainly from higher compensation and government social benefits.
The gap came out of savings. Personal saving totaled $990.2 billion in August, and the saving rate was 4.1% of disposable income, the BEA said. A household sector that spends more than it takes home cannot keep doing so indefinitely, which is why the combination of flat real income and strong real spending drew attention from analysts. Tech Times described it as the opposite of the demand slowdown that would support confidence that inflation is fading.
Job market and rate decisions ahead
The labor market gives households some cushion. The Bureau of Labor Statistics reported on Sept. 29 that employers had 7.1 million job openings in August, a rate of 4.3%, little changed from July. Layoffs and discharges were 1.6 million, or 1.0% of employment, and quits were 3.1 million.
The BLS also revised July up, to 7.3 million openings from its earlier estimate, a gain of 64,000, so the August figure of 7.1 million represents a decline of about 200,000 from the revised July level, even though the agency described the change as little. Hires were 5.2 million, and total separations were 5.1 million.
Fed policymakers meet again in October. Deseret News reported the benchmark rate sits at 3.75% to 4%. Tech Times said the softer August figures reduce pressure for a rate increase at that meeting, though the Fed needs to see sustained progress before changing course.
The next PCE report is scheduled for Oct. 29. That release will show whether prices cooled again under the new method or whether the August reading reflected the one-time effect of the revisions. Gasoline and diesel prices will also matter, since both remain far above year-ago levels. Deseret News reported Utah drivers paying $5.00 a gallon on Sept. 30, $1.61 more than a year earlier.