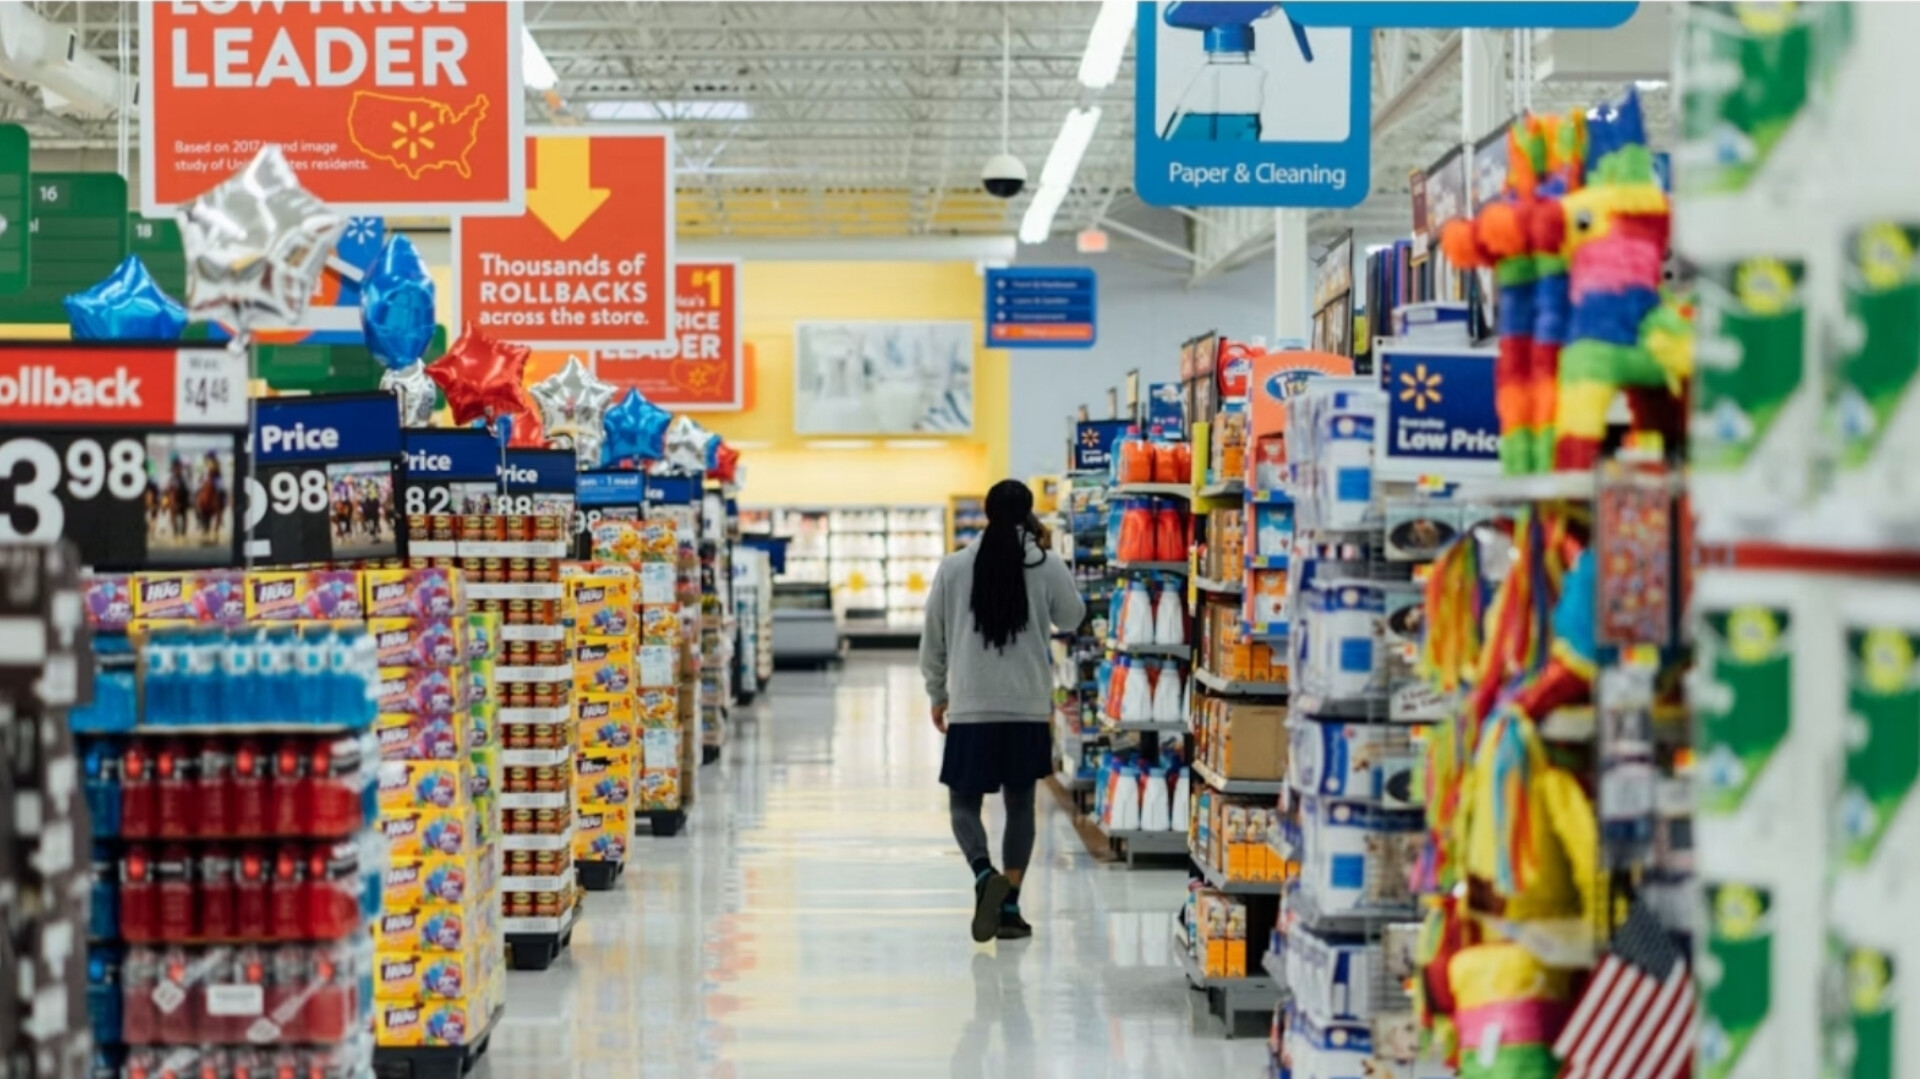
U.S. retail and food services sales rose 0.8% in September to $745.0 billion, the Census Bureau said Oct. 15, and sales were 6.3% above September 2025. Gas stations posted the largest gain among the categories the bureau listed, up 6.4% from August, according to its advance report.
What the Census Bureau Reported
The bureau’s advance estimate puts September sales at $745.0 billion on a seasonally adjusted basis. The monthly gain carries a margin of plus or minus 0.4 percentage point, and the yearly gain a margin of plus or minus 0.5 point, according to the report.
The bureau revised August upward. August sales are now $739.3 billion, up 1.3% from July. The first estimate of that monthly gain was 1.1%. The revision raised the base for September, and the 0.8% gain is measured against the higher August figure. September’s gain in dollars was $5.7 billion, a calculation from the two monthly totals. For the third quarter, sales ran 5.5% above the same quarter of 2025, the bureau said. The next report, covering October, is scheduled for Nov. 17.
Gasoline and Eating Out Lead the Categories
The bureau listed monthly and yearly changes for several kinds of businesses. Gas stations rose 6.4% on the month and 28.1% on the year. Food services and drinking places rose 1.1% on the month and 7.0% on the year. Furniture and home furnishings stores rose 1.3% and 4.9%. Electronics and appliance stores rose 0.6% and 9.4%. Nonstore retailers, which include online sellers, rose 0.3% and 8.2%.
Clothing and accessories stores were unchanged on the month and up 5.0% on the year. Health and personal care stores rose 0.7% on the month but fell 1.2% on the year. Miscellaneous store retailers fell 3.0% on the month and rose 10.9% on the year.
The gas station figure tracks fuel prices. The Bureau of Labor Statistics reported Oct. 14 that its gasoline index rose 9.1% in September on a seasonally adjusted basis and was up 34.2% over 12 months, according to its CPI release. Gas station sales were up 28.1% over the same 12 months, which is 6.1 percentage points below the price index. The two measures are not built the same way, because station sales include items other than fuel, and the Census figures are not adjusted for price changes.
That lack of price adjustment matters for the headline. The Census total is a dollar figure. The BLS reported that consumer prices overall rose 3.7% over 12 months. Subtracting 3.7 from the 6.3% yearly sales gain leaves 2.6 percentage points, a rough comparison of two different measures, not a figure either agency published.
A Second Reading from the Retail Federation
The National Retail Federation publishes its own monthly measure with CNBC. Its Oct. 8 release said retail sales rose for a 12th straight month in September. Excluding autos and gas, sales were $560.8 billion, up 0.28% from August and 4.05% from a year earlier. Excluding restaurants as well, the federation’s core figure was $453.1 billion, up 0.27% on the month and 3.73% on the year.
The federation’s yearly gain of 4.05% sits well below the Census yearly gain of 6.3%. The two totals cover different things. The Census total includes auto dealers and gas stations, and the federation’s figure leaves both out. Gas stations alone rose 28.1% on the year in the Census data.
The two sources disagree on furniture. The Census Bureau reported furniture and home furnishings stores up 4.9% over 12 months. The federation reported that category down 2.7% over 12 months, the only category it measured that fell. The federation said its monitor attributes online sales from store-based retailers to product categories, and it reports non-store sales separately. Electronics show smaller disagreement: the Census Bureau reported electronics and appliance stores up 9.4%, and the federation reported electronics and appliances up 8.41%.
NRF President and CEO Matthew Shay said in the release that “consumers continued to spend” after a solid back-to-school season. He said households remain budget conscious and focused on everyday essentials, and that retailers are relying on promotions and value pricing.
The federation said the September release began a new methodology. The monitor now draws on a panel of about 120 million anonymized debit and credit cards from Affinity Solutions. The release said its month-over-month and year-over-year changes are not directly comparable with figures published before September 2026.
What Jobless Claims Show
The Labor Department reported the same morning that initial unemployment claims were 199,000 in the week ending Oct. 10, up 1,000 from a revised 198,000, according to its weekly claims release. The four-week average was 198,500, up 250. Continued claims, which count people still collecting benefits, were 1,710,000 for the week ending Oct. 3, down 4,000. The insured unemployment rate held at 1.1%.
Before seasonal adjustment, initial claims were 190,626, up 19,456 or 11.4% from the prior week. The same week in 2025 had 210,777 claims, so this year’s unadjusted count is 9.6% lower, a calculation from the department’s figures. Unadjusted continued claims were 1,469,083, compared with 1,651,988 a year earlier, a drop of 11.1% by the same method.
California reported the largest increase in initial claims for the week ending Oct. 3, up 4,295, followed by Illinois at 1,108 and New Jersey at 856. For the week ending Oct. 3 the highest insured unemployment rates were in New Jersey at 2.0%, Massachusetts and Washington at 1.8% each, California at 1.7% and Nevada at 1.6%.
What Comes Next
The bureau will publish October retail sales on Nov. 17. The Bureau of Labor Statistics will release the October consumer price index on Nov. 10, which will show whether gasoline prices kept rising after September’s 9.1% monthly jump.